
Back to Blog

Transaction Landing on TPU
Written By
Kirill Lykov (Anza), Alessandro Decina (Anza), Max Resnick (Anza), Greg Cusack (Anza)
February 11, 2026
Intro
The quality of transaction delivery is existentially important for Solana’s user experience. Over the last few months we have been gathering data on transaction delivery with our new transaction landing implementation. In this post, we look at how the network is doing with respect to transaction landing as well as data on how network delay and validator behavior impact those metrics.
Users can send transactions using several methods, including direct submission to the leader’s TPU port, RPC, Jito Bundles, Harmonic bundles, and other landing services. Among these, sending transactions directly to the TPU is the lowest network latency path and is the focus of this post. Delivering a transaction via RPC - the method used by most users - involves sending the transaction to some proxy using the json-RPC protocol. Jito Bundles provide a way to send several transactions bundled together such that they are atomically executed in the provided order.
When sending directly to TPU, since leaders rotate over time, clients must know which leader to send transactions to. We call this process targeting, and it is one of the most important ingredients in a high quality TPU sending implementation. Two components are required to implement leader targeting: the leader schedule, which is pre-computed and fixed within an epoch, and the current slot.
A common way to track the current slot is to observe the FirstShredReceived (slot started) and Completed (slot finished) events from RPC, gRPC or the websocket API. In order to hide network latency, clients pre-connect to the next few leaders in advance, so connections are already established when it is time to send transactions. To mitigate the risk that a leader won’t include a transaction, applications often broadcast transactions to several future leaders. The number of future leaders a transaction is sent to is known as the fanout.
Transactions can be sent to the leader using either a staked or an unstaked connection. By default, the connection is unstaked, which means that the server does not associate the traffic in the connection with any staked validator under stake-weighted-quality-of-service system (for details see this article). Unstaked connections have a shorter lifetime and provide less bandwidth than a staked connection to prevent possible spam of low-quality transactions coming from unknown client applications. To establish a staked connection, users need to provide a staked validator identity.
The quality of transaction delivery can be characterized by several factors. Here we concentrate on two: transaction latency and drop rate. Transaction latency is defined as the distance, in slots, between the slot predicted by the client in the leader targeting process and when the transaction is included in a block. The drop rate is the percentage of transactions sent but not added to any block.
In the rest of this post, we investigate slot latency and transaction drops. In order to analyze the quality of transaction delivery, we developed a tool called rate-latency-tool. We used rate-latency-tool to send transactions to different leaders at various RTTs across the globe. Our findings show that sending transactions over a staked connection to the TPU, even with a small fanout, results in a slot latency below 0.5 slots and a moderate drop rate of about 3%. We also found that transactions are distributed non-uniformly within the block. While RTT explains the initial offset in transaction placement, the dominant factors are the validator type and the scheduler modifications it employs.
Experiment Setup
rate-latency-tool is used to send transactions at a fixed rate using a staked connection, sending one transaction every 100ms. For leader targeting and connection management, the tool uses the tpu-client-next crate from the master branch at the time of writing (commit).
Experiments are conducted from three geographic locations: Amsterdam, Bluffdale (Utah), and Tokyo, each time for a duration of 30 minutes. Most of Solana’s stake is located near Amsterdam, allowing us to look at both inter- and intra-region client-leader connections. Figure 1 shows the RTT distributions observed from each client location to various leaders.
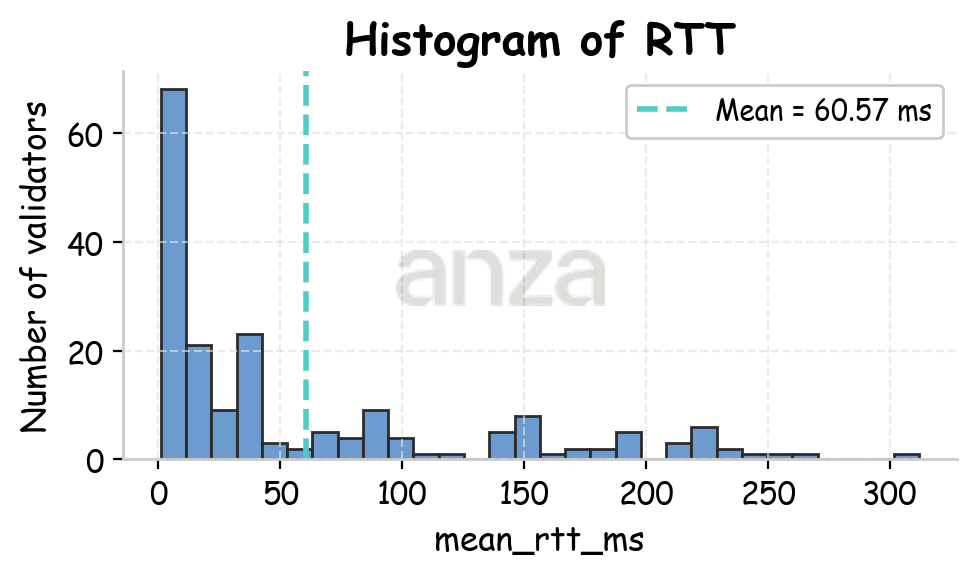 | 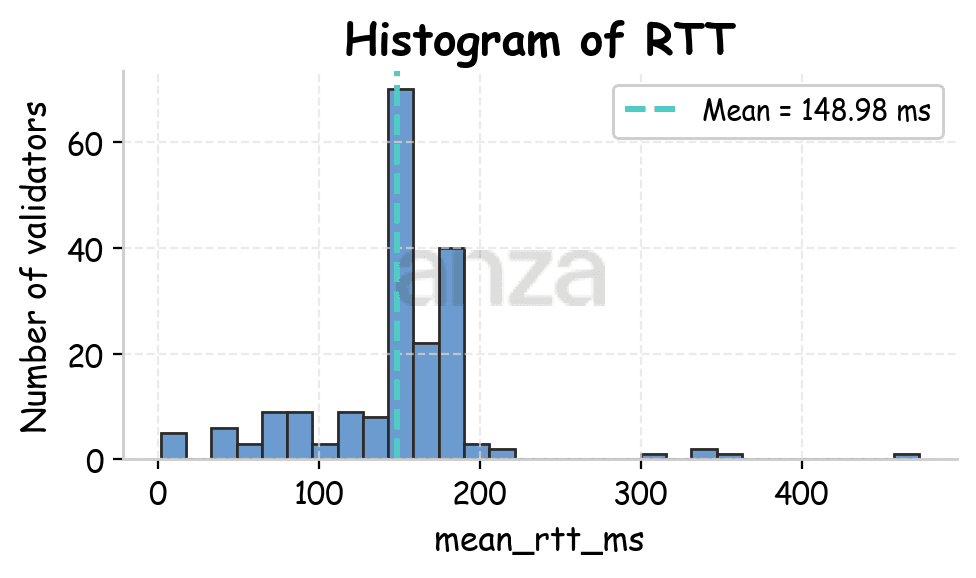 | 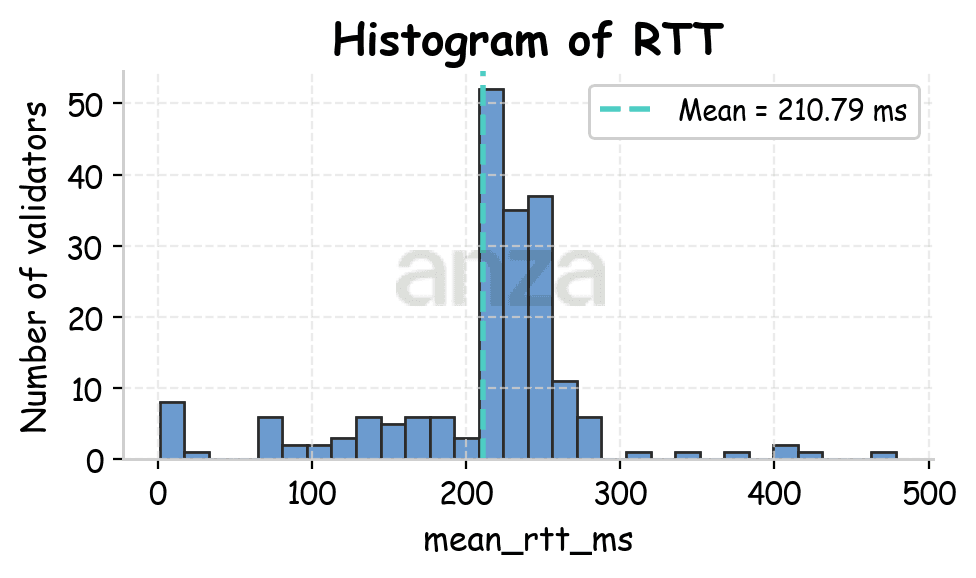 |
Fig 1. RTT distributions for Amsterdam (mean 60.57ms), Utah (mean 148.98ms), and Tokyo (mean 210.79ms). | ||
The tool estimates the current slot using a stream of shred updates obtained via Triton’s gRPC interface, which provides consistent slot timing across all locations (see Appendix).
A key parameter of the experiment is the fanout. Let’s define a leader window as a consecutive sequence of slots during which the leader does not change. Transactions sent near the end of a leader window risk being in flight during a leader transition and may be lost. Instead of explicitly accounting for RTT and other latencies, we use the new leader-targeting code in tpu-client-next that implements a dynamic fanout. Here, transactions are sent only to the current leader when the estimated slot is within the first three slots of the leader window, and to both the current and next leader when the estimated slot is the final slot of the window. The connection fanout is the send fanout plus one, which means that we connect to the next leader 4 or 8 slots in advance.
Transaction Latency
When sending transactions from Amsterdam, Utah, and Tokyo, the measured slot latency is 0.29, 0.66, and 0.72 slots, respectively. The difference in RTT between Utah and Tokyo is ~61.81ms. 0.72-0.66 = 0.06 slots, which corresponds to roughly to 0.06 * 400ms = 24ms. So partially the added slot latency may be explained by an increase in RTT.
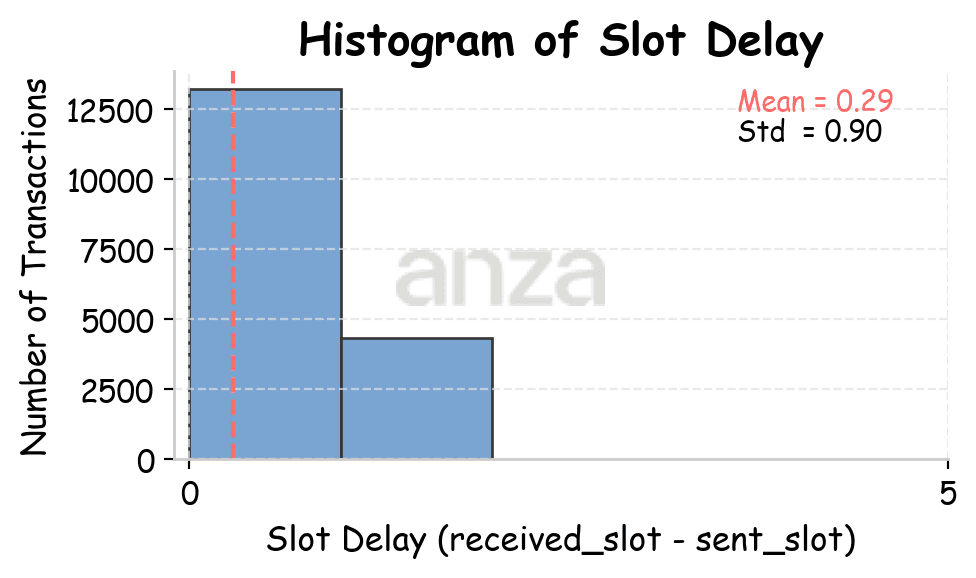 | 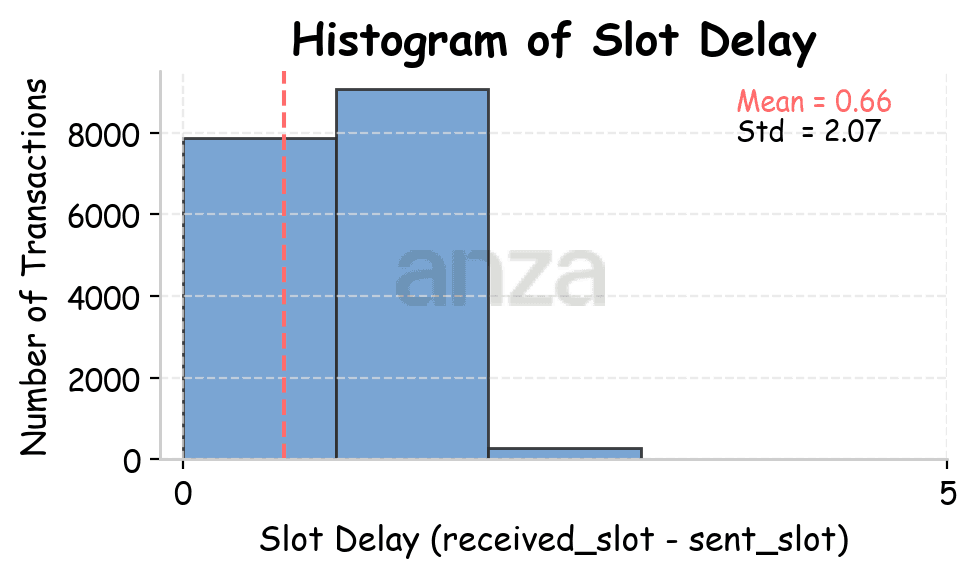 | 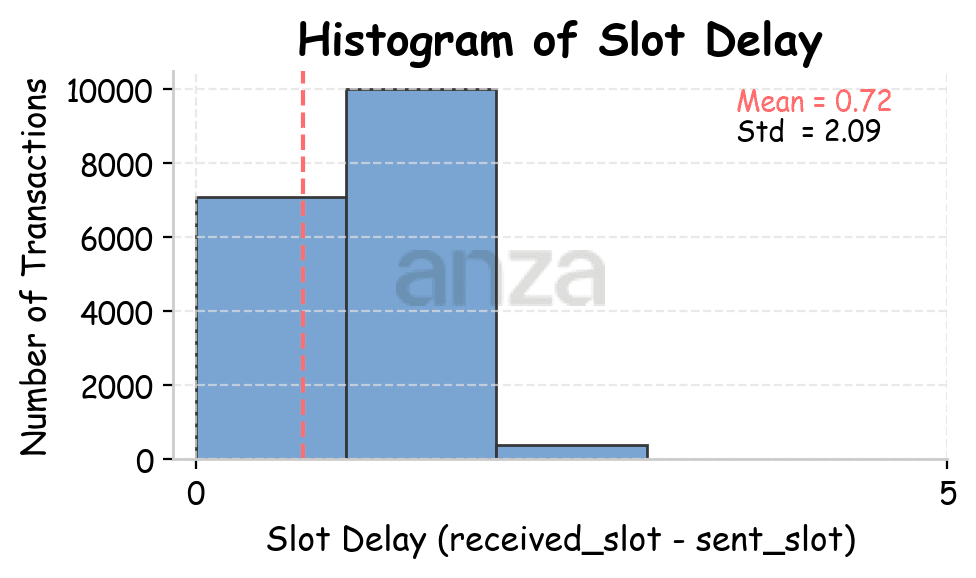 |
Fig 2. Slot latency distributions across different points of presence (Amsterdam, Utah, and Tokyo), after filtering out values above the 99th percentile. | ||
Transaction Distribution
We find that transactions sent uniformly over time are placed non-uniformly within blocks. To understand this behavior, we analyze how landed transactions are distributed inside a block. Transaction IDs don’t give us a sense of time ordering within a block (see Fig. 3, left). Instead, we use block ticks to approximate time. Each block contains 64 ticks, and for each transaction, we identify the tick in which it was included.
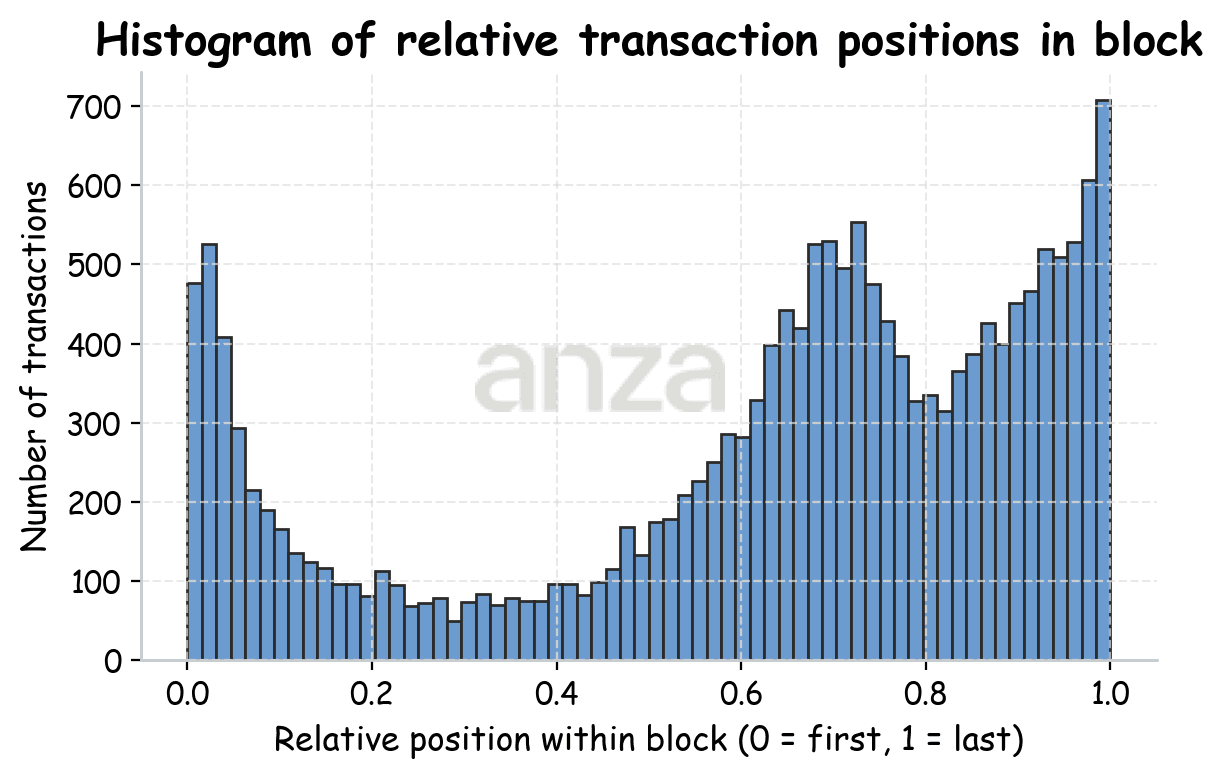 | 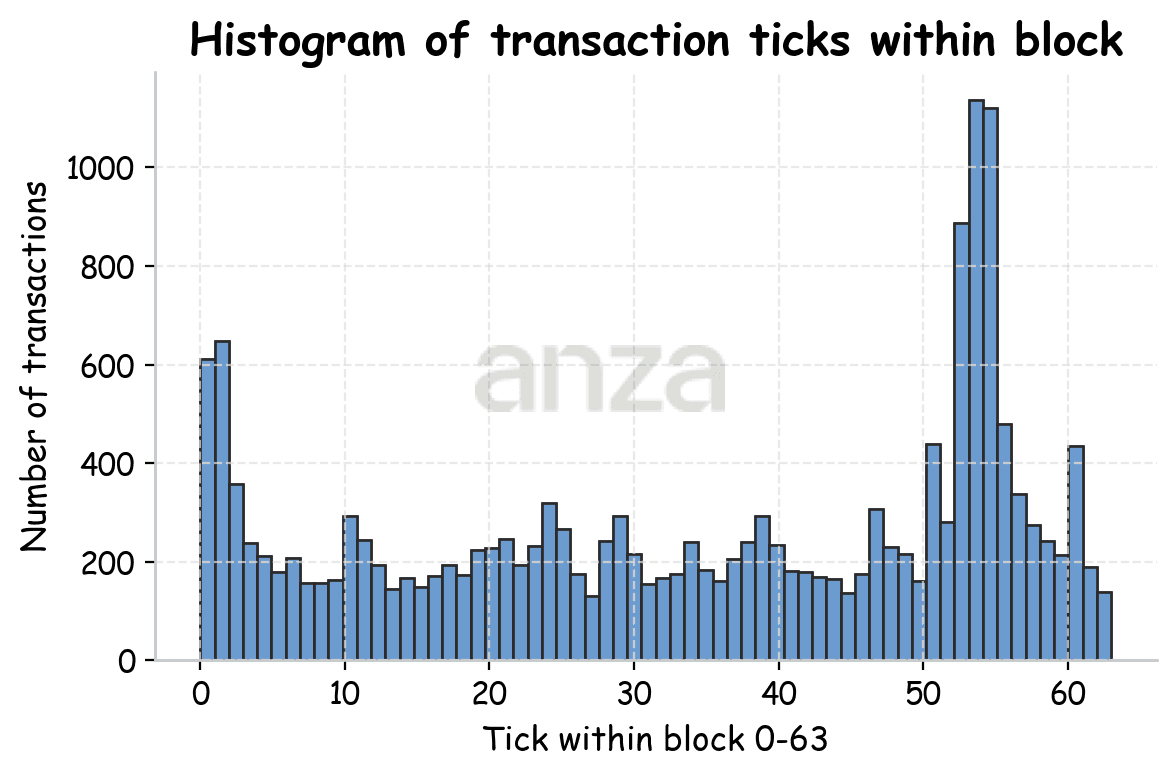 |
Fig 3. Left: normalized transaction ID distribution over block. Right: distribution of ticks within the block. | |
Unfortunately, attributing transactions to ticks is not trivial. With the help of Louis-Vincent Boudreault (Triton One) and Triton’s gRPC data, we were able to subscribe to entry updates where each entry is either a tick (empty) or a non-tick (contains transactions). This allows us to determine the ordering of transactions in the block based on their transaction ID within ticks.
Looking at Fig 3 (right) it seems that our transactions are distributed more or less uniformly over the block. To make the structure clearer, we change the data representation by splitting transactions according to slot latency (Fig. 4). Ticks of transactions with slot latency 0 are placed on the left, and for slot latency 1 – on the right.
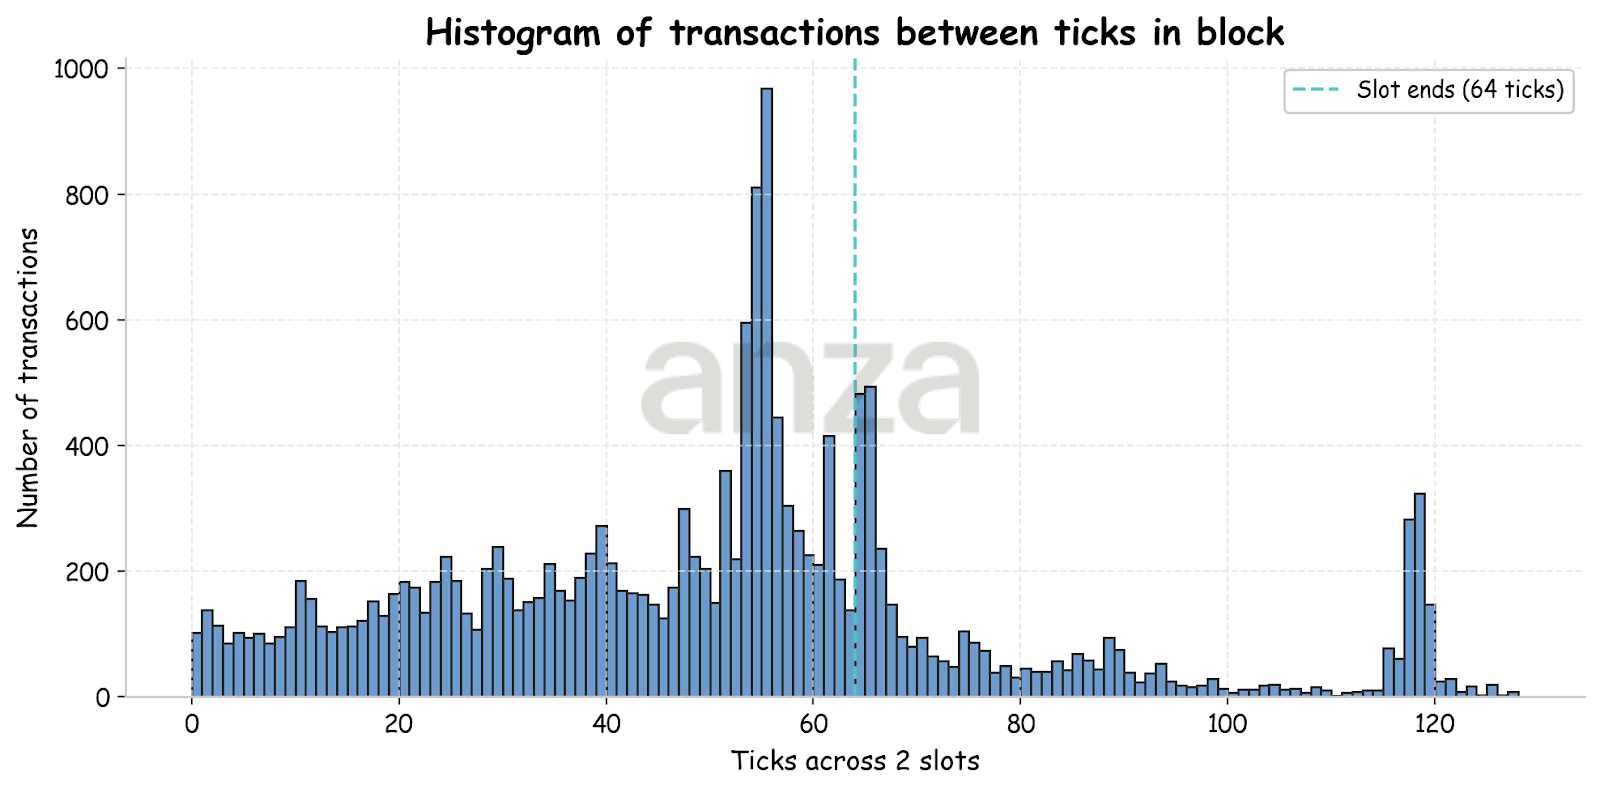 | |
Fig 4. The distribution of ticks within a block is arranged such that transactions delayed by one slot appear on the right-hand side. |
In Fig. 4, we can see that, despite transactions being sent uniformly over time, they are distributed non-uniformly within the block. The resulting histogram shows several pronounced spikes, including two near the end of the first and second slots. This pattern is consistent across multiple runs and across different estimated slot positions within the leader window.
To understand whether these spikes are correlated with validator implementation, we next break down the tick distributions by validator version. Figure 5 shows the tick distribution split by validator software: Agave, Firedancer, Frankendancer, Harmonic, Jito BAM, Paladin Agave, and Jito Labs. To identify validators software we used data provided by Jito, gossip, and corrections from https://schedulerwar.vercel.app/. The transaction distributions differ noticeably across implementations.
Validators running the Jito fork exhibit the most uniform distribution. AgaveBAM demonstrates prominent spikes which could be explained by 50ms batches. Frankendancer has a few different packing strategies. In our classification, we separate “revenue” strategy Frankendancer nodes from the rest (see FD). Frankendancer revenue validators demonstrate a spike of transactions towards the end of the block because they place TPU transactions at the end of the slot, while Jito bundles are added to the first ¾ of the block. Despite this strategy being marked “deprecated” in the documentation, it seems to still be a popular choice. Harmonic validators consistently place transactions near the end of the slot, suggesting modifications to the transaction scheduler. For Firedancer, the sample size is too small to draw meaningful conclusions but available data suggests that it has similar behavior to Frankendancer Revenue.
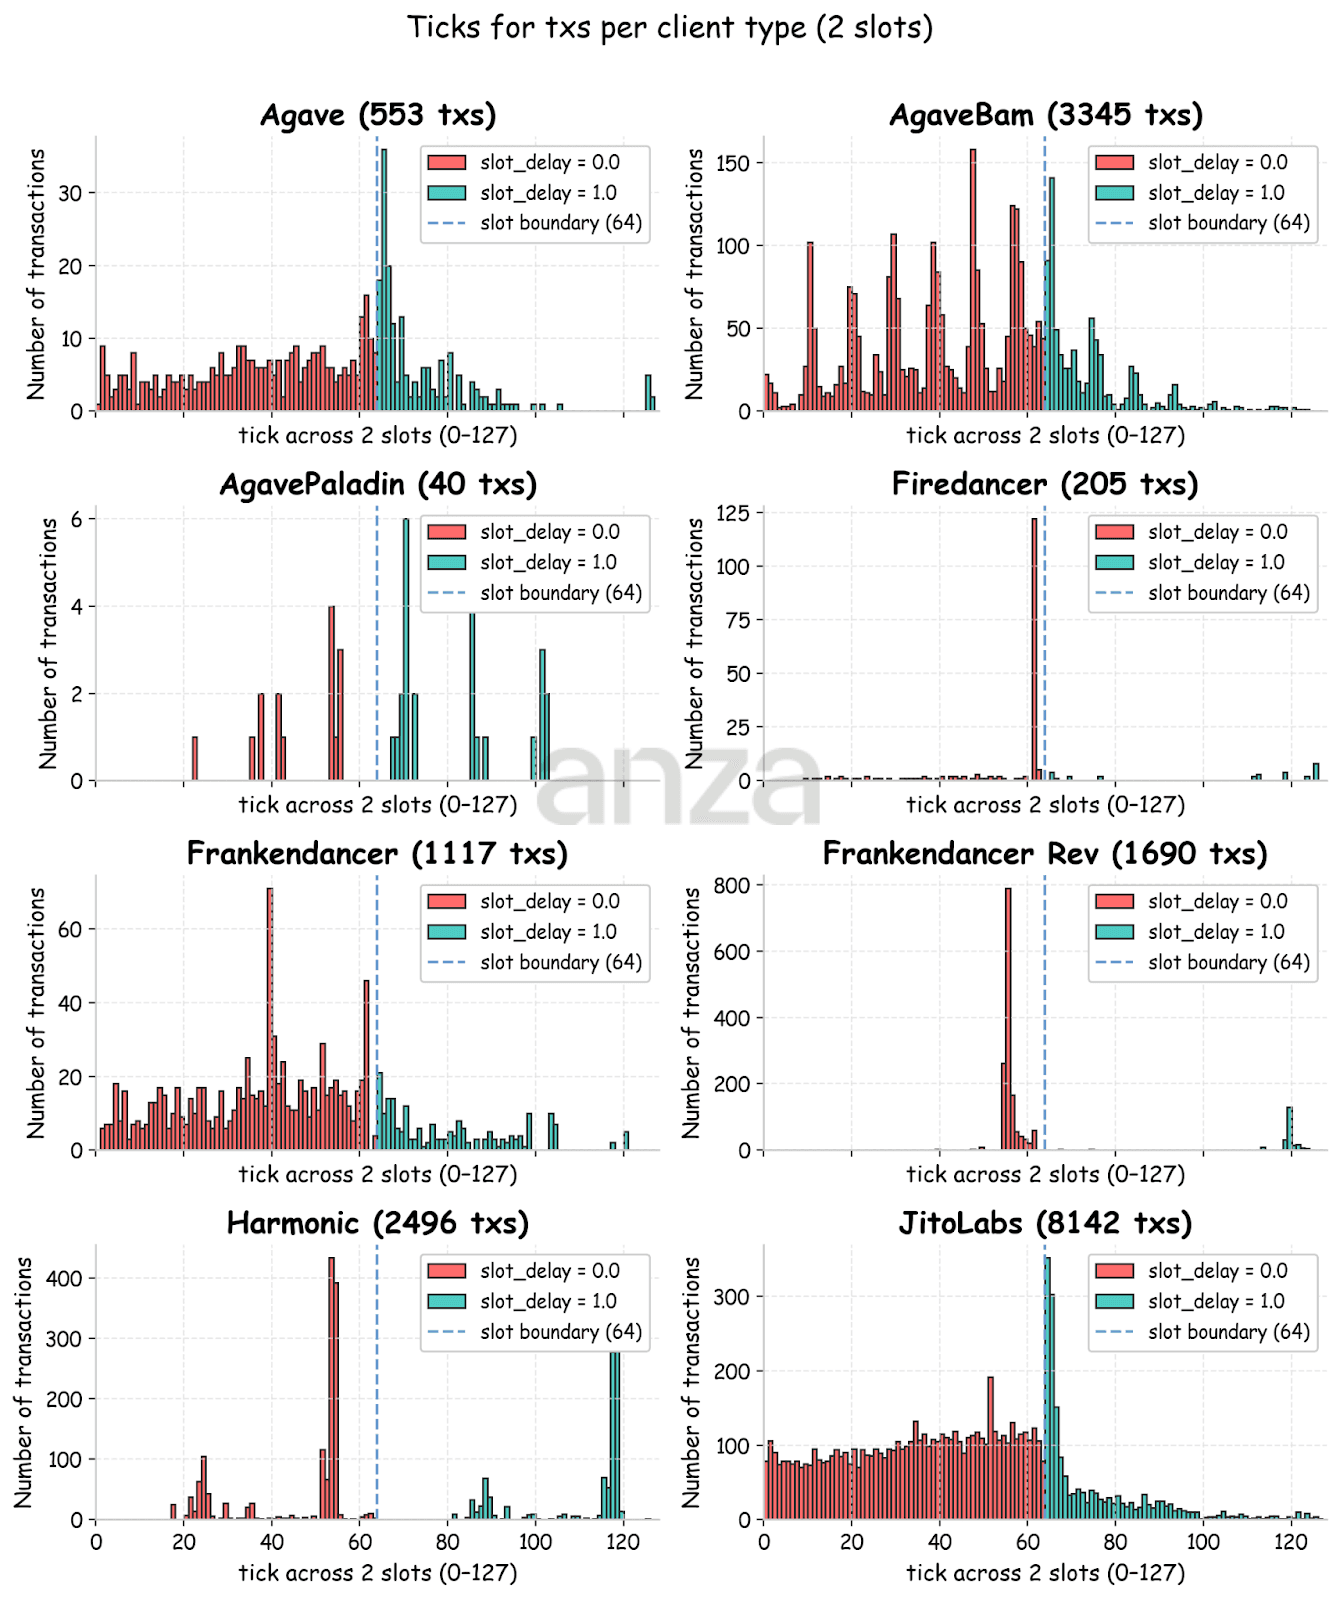 |
Fig 5. Distribution of the ticks classified by type of validator software. |
Let’s look at the cumulative distribution function (CDF) of slot ticks in Fig. 6. For Amsterdam, vanilla Agave, some of its forks (JitoLabs, AgaveBam), and Frankendancer behave similarly: they start adding transactions from the first tick of the slot, and the curve shapes are similar, except for the step-like pattern in AgaveBam. Other validator types show distinctly different behavior, with transactions added much later in the slot and in a more irregular fashion. For the Utah and Tokyo runs, the CDFs are similar overall, aside from an initial delay that is likely due to higher RTT.
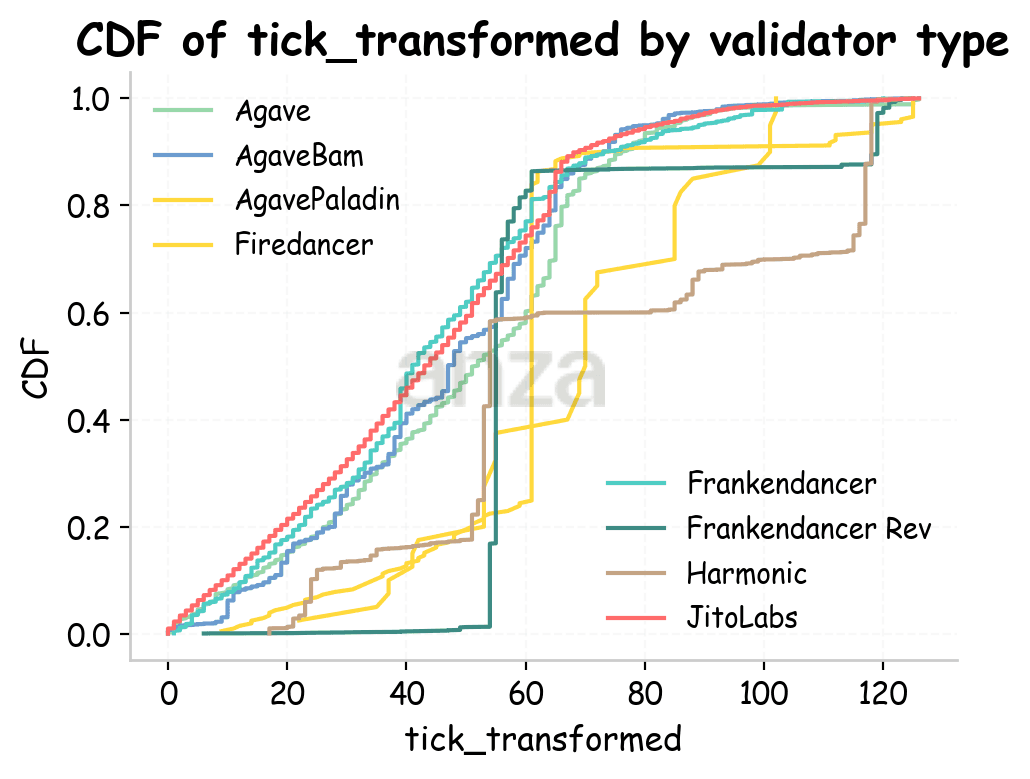 | 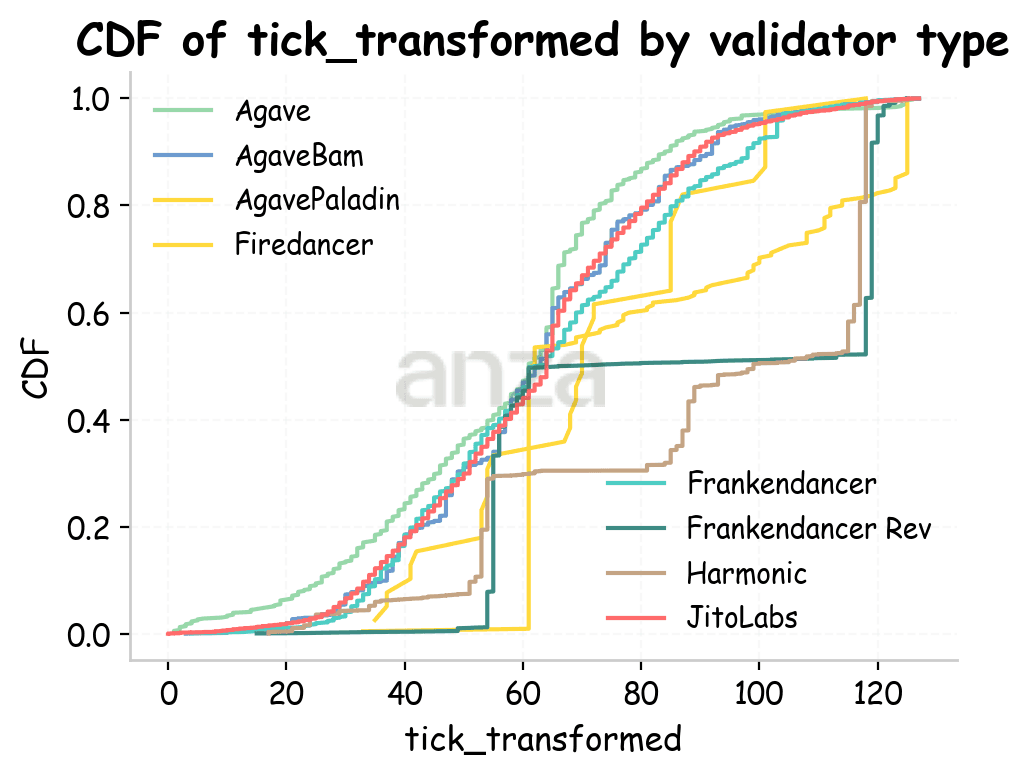 | 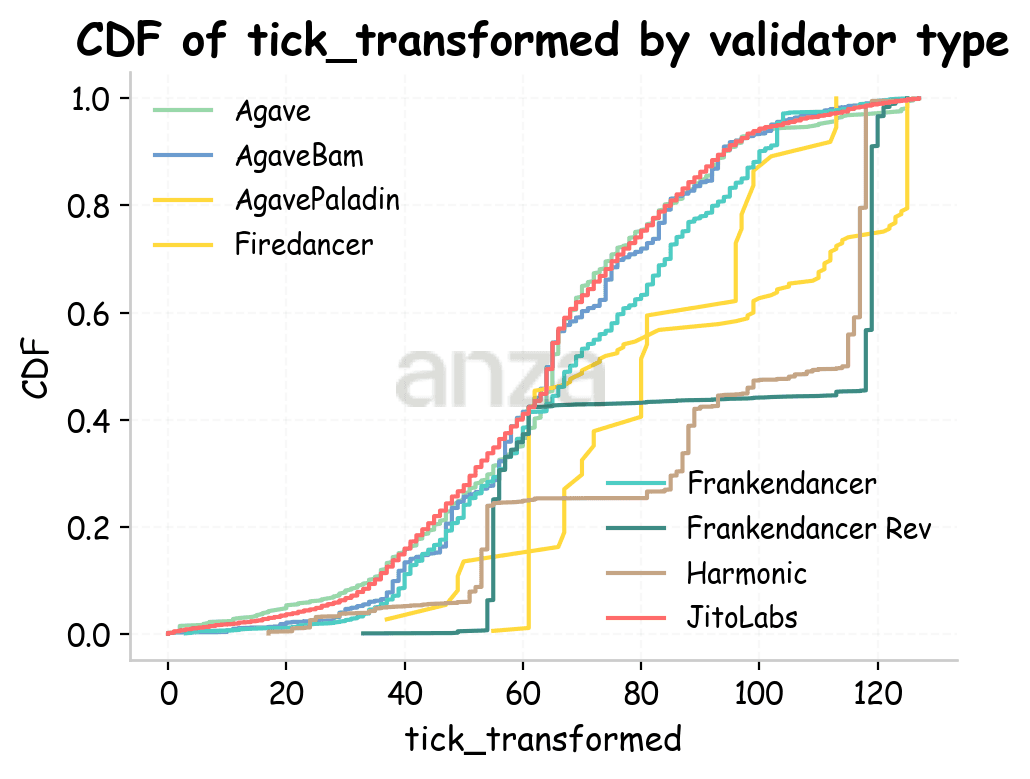 |
Fig 6. Cumulative distribution function of ticks for different validator types for Amsterdam, Utah, and Tokyo. Ticks are transformed to take into account slot latency. | ||
Let’s look deeper into the Jito Labs validators and examine how the tick distribution varies by region (Fig. 7). For each of the three locations, we observe that when the client and leader are in the same region, transactions tend to be included early in the slot, aside from a small number of outliers. The measured slot latencies are 0.25 ± 0.9 when sending from Amsterdam to European validators, 0.47±1 from Utah to North America, and 0.29 ± 0.46 from Tokyo to Asia. These measured slot latencies depend heavily on the overall network load, which can be attributed in part to block fullness in terms of compute units (CUs). At the time of our experiments, blocks averaged 40 Million CUs.
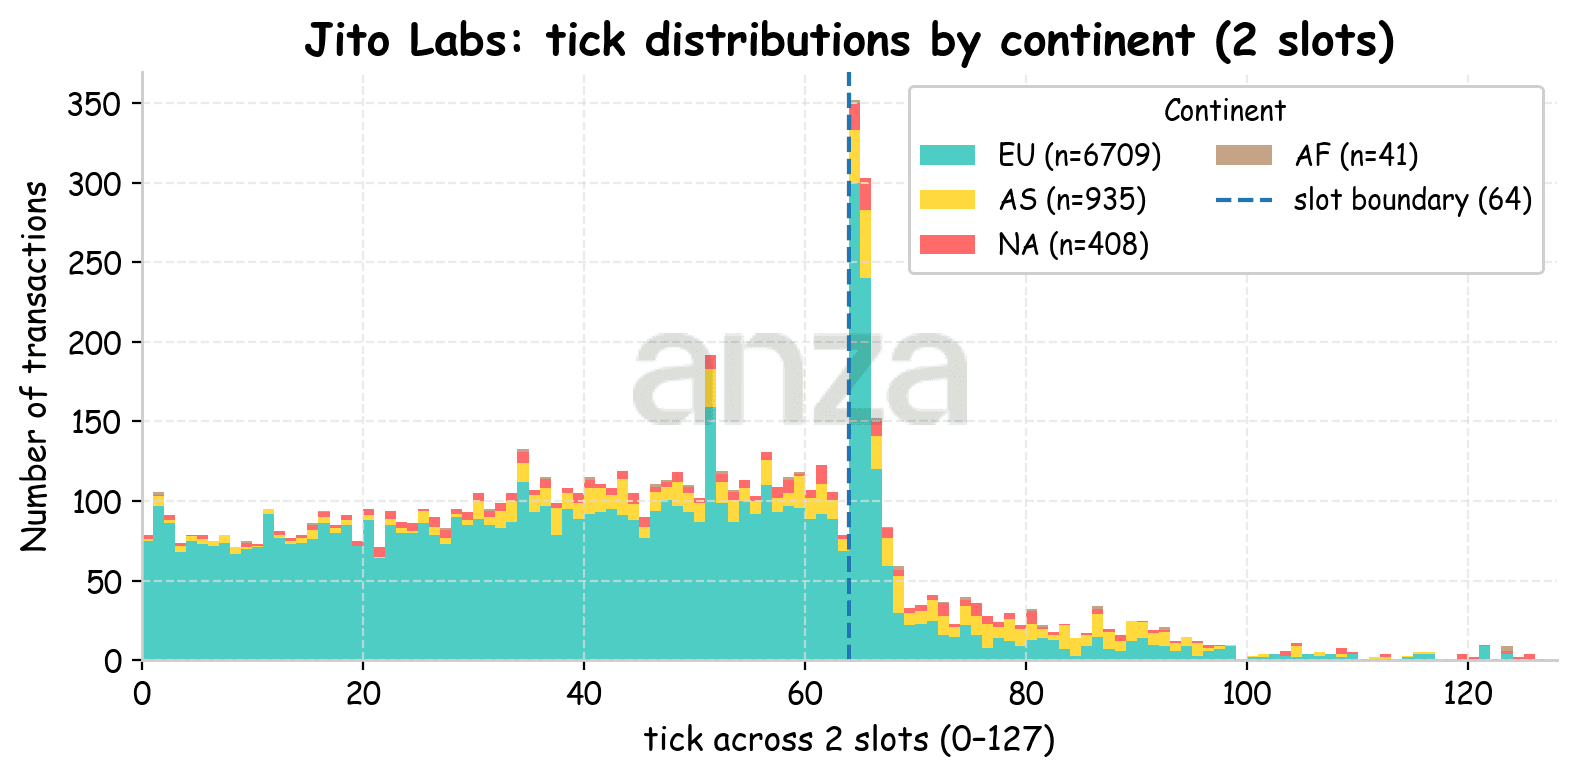 | ||
Fig 7. Stacked histogram of transaction ticks for a client launched from Amsterdam. Colors indicate the continent where the validators are located. |
If we examine the same stacked histograms for Jito Labs validators with the client launched from Utah (Fig. 8) and Tokyo (Fig. 9) we can see a clear shift in transaction inclusion. Since most validators are located in Europe, transactions sent from Utah are typically included after tick ~20 (≈125 ms), while transactions sent from Tokyo are included after around tick ~28 (≈175 ms). This shift is largely explained by the increase in one-way network delay (RTT/2), which is approximately 81ms from Utah to EU and 116 ms from Tokyo to EU.
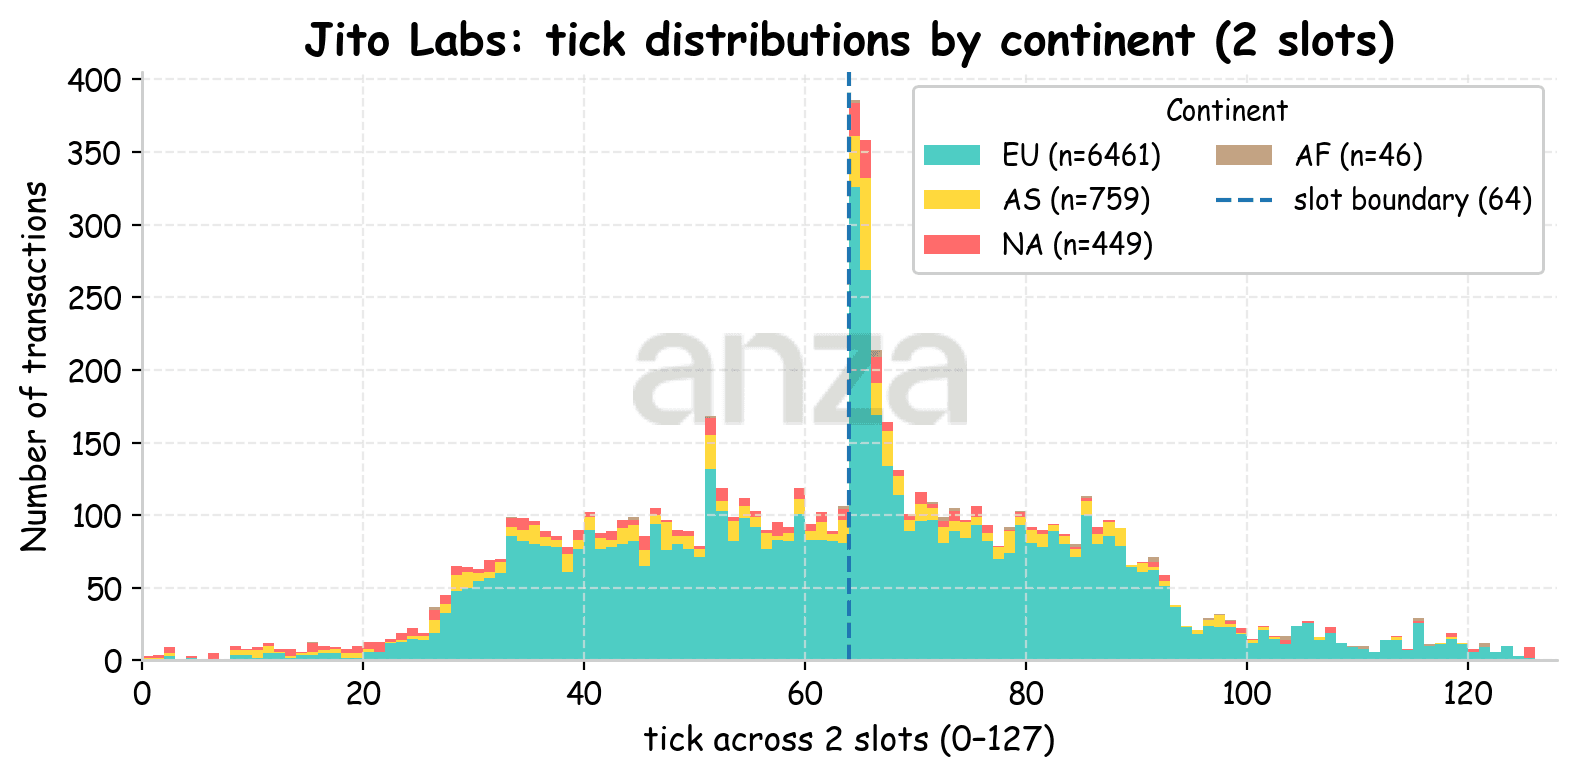 |
Fig 8. Stacked histogram of transaction ticks for a client launched from Utah. Colors indicate the continent where the validators are located. |
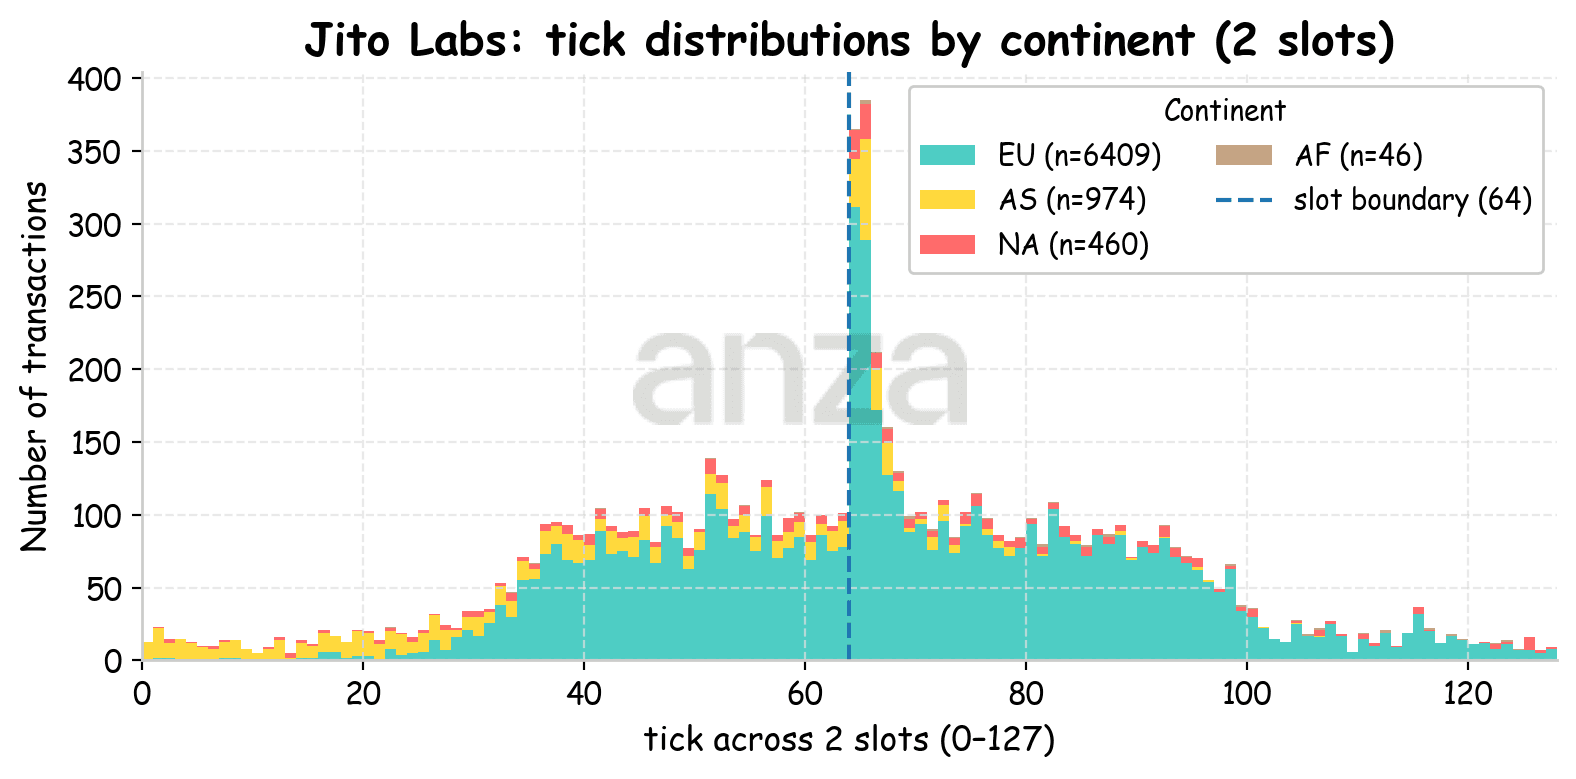 |
Fig 9. Stacked histogram of transaction ticks for a client launched from Tokyo. Colors indicate the continent where the validators are located. |
We also observe several abnormal spikes in these histograms. One recurring spike occurs right after the end of the slot boundary. It means that when slot delay is one, there is an abnormally high probability that a transaction will land at the first 2 ticks. This behavior cannot be explained by specific validator versions alone and may reflect transactions that are either received too late or cannot be scheduled within the slot when the leader received it. In other words, this spike is most likely caused by transactions that were received in the previous slot and carried over, rather than by other limitations such as network conditions or slot update latency on client side.
In summary, our measurements show that slot latency is strongly influenced by client location and network delay, but network latency alone does not fully explain the observed behavior. While increased RTT accounts for a substantial fraction of the higher slot latency seen from more distant locations such as Utah and Tokyo, transaction placement within blocks reveals additional structure. When transactions are sent uniformly over time, they are added to blocks in a highly non-uniform manner. When breaking down these distributions by validator software and geography, we find that Jito Labs validators exhibit the most uniform distribution of transactions within the block, while Frankendancer Revenue and Harmonic validators show distinctive scheduling patterns that contribute to spikes near slot boundaries. Finally, some spikes—particularly those occurring just after the end of a slot—cannot be attributed to specific validators alone and likely reflect situations where transactions are deferred to the next block when they cannot be included in the current one.
Transaction Loss
Another important characteristic of transaction delivery service quality is the fraction of transactions that fail to land in a block. In these experiments, connections are established in advance to hide the connection setup latency, and transactions are sent at a fixed 100ms interval.
Transactions may be dropped for various reasons, including:
Leader targeting errors: client incorrectly estimates leader and sends to non leader
Block capacity limits: transaction sent to correct leader, but block is already full
Network related issues: transaction never makes it to the leader.
Fork-related losses: transaction is included in a block on a fork that is discarded
Scheduling failures: transaction is sent to the correct leader, but it is not added to the block
Practically, (1) is rare because the inaccuracy of the leader estimation is covered by dynamic fanout; (4) is also uncommon on mainnet but interestingly happens quite often on testnet due to slot stretching. Other reasons might be valid for further discussion.
If we look at the number of lost transactions sent from Amsterdam, we observe that 2.0% of transactions were sent but lost, and 0.3% were not sent at all (see Fig. 10). Most of the transactions that could not be sent occur in temporal clusters, indicating that certain validators may refuse incoming connections or experience intermittent network connectivity issues. This interpretation is further supported by the compute-unit usage of the targeted blocks, which is typically well below the network average.
Regarding transactions that were sent but lost, we observe that approximately 3% of the blocks targeted by our tool and containing lost transactions end up including only vote transactions. In addition, around 24% of lost transactions occur when targeting blocks that are close to being full (exceeding 50 M CUs).
An inspection of the data shows that sent but lost transactions can be divided into two categories. The first category consists of transactions that are distributed approximately uniformly over time and do not form clusters of consecutive losses, while the second category consists of consecutive losses. Transactions in the first category are rarely located at the edges of leader windows.
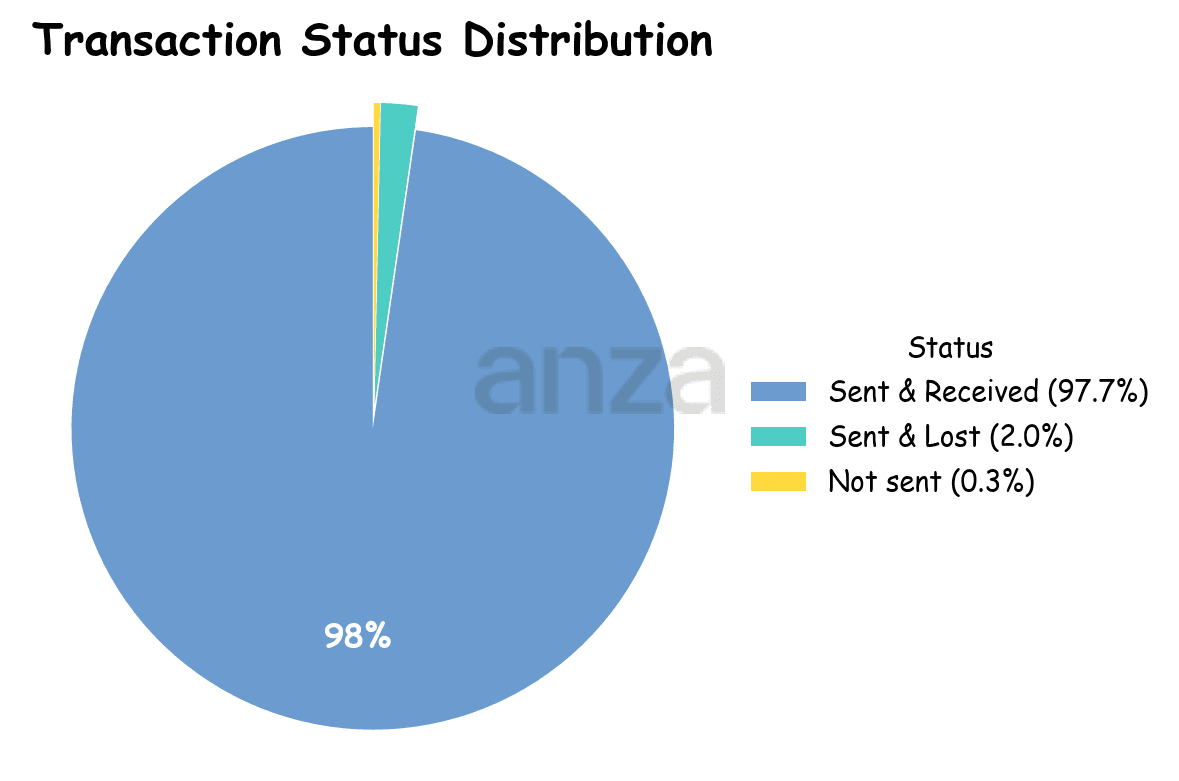 | |
Fig 10. Transactions status distribution for rate-latency-tool running from Amsterdam. |
Regardless of the tool’s location, most lost transactions were sent to the AgaveBAM client (see Fig. 11). A closer inspection shows that transactions lost by these validators generally do not form clusters of consecutive losses; instead, they are isolated events and do not target full blocks—the observed utilization was around 40 M CU, while the reserved capacity was approximately 109 M CU. However, a small number of AgaveBAM validators skipped their slots during the run, and transactions lost in these cases form clusters of consecutive losses.
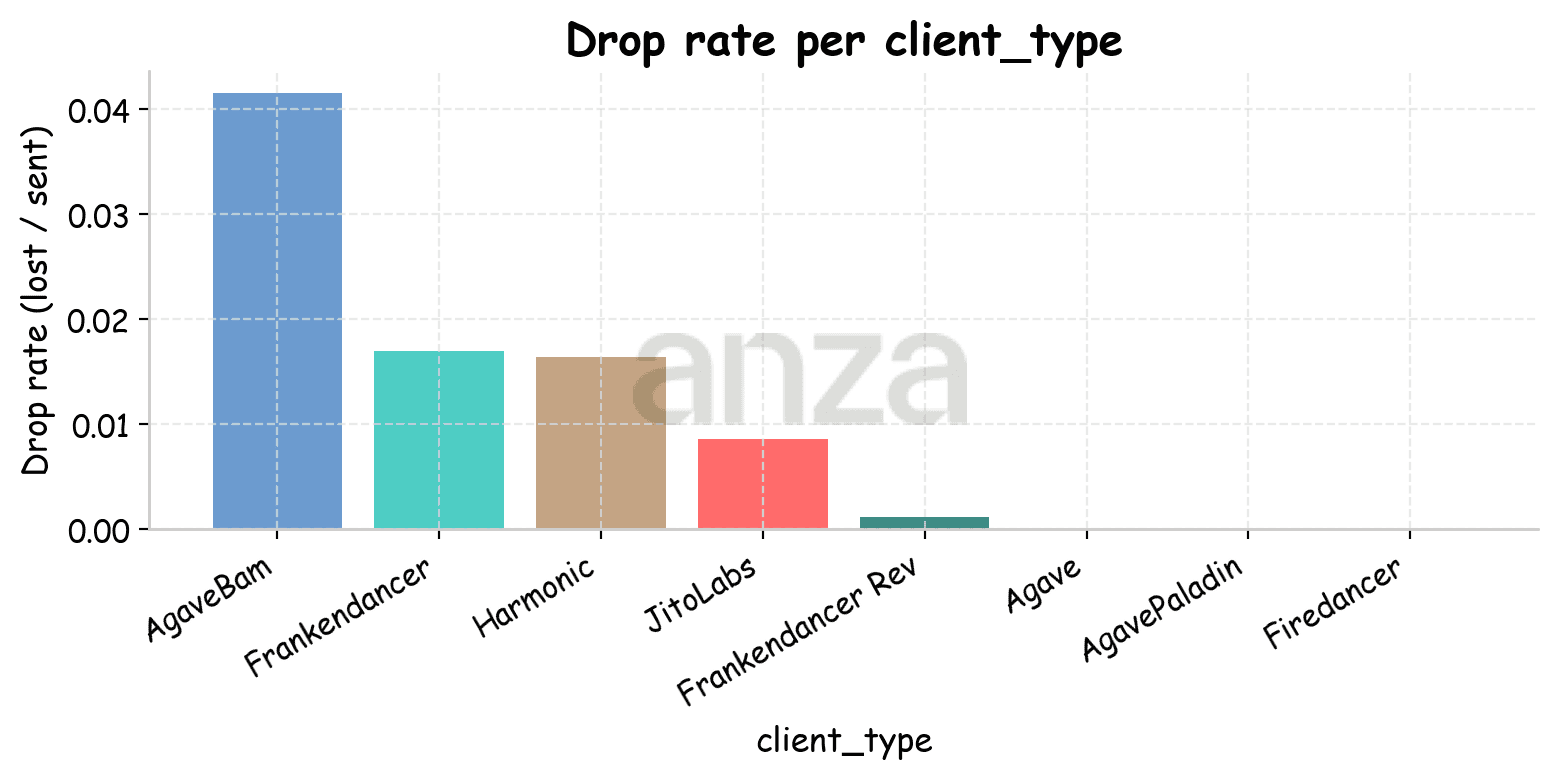 | 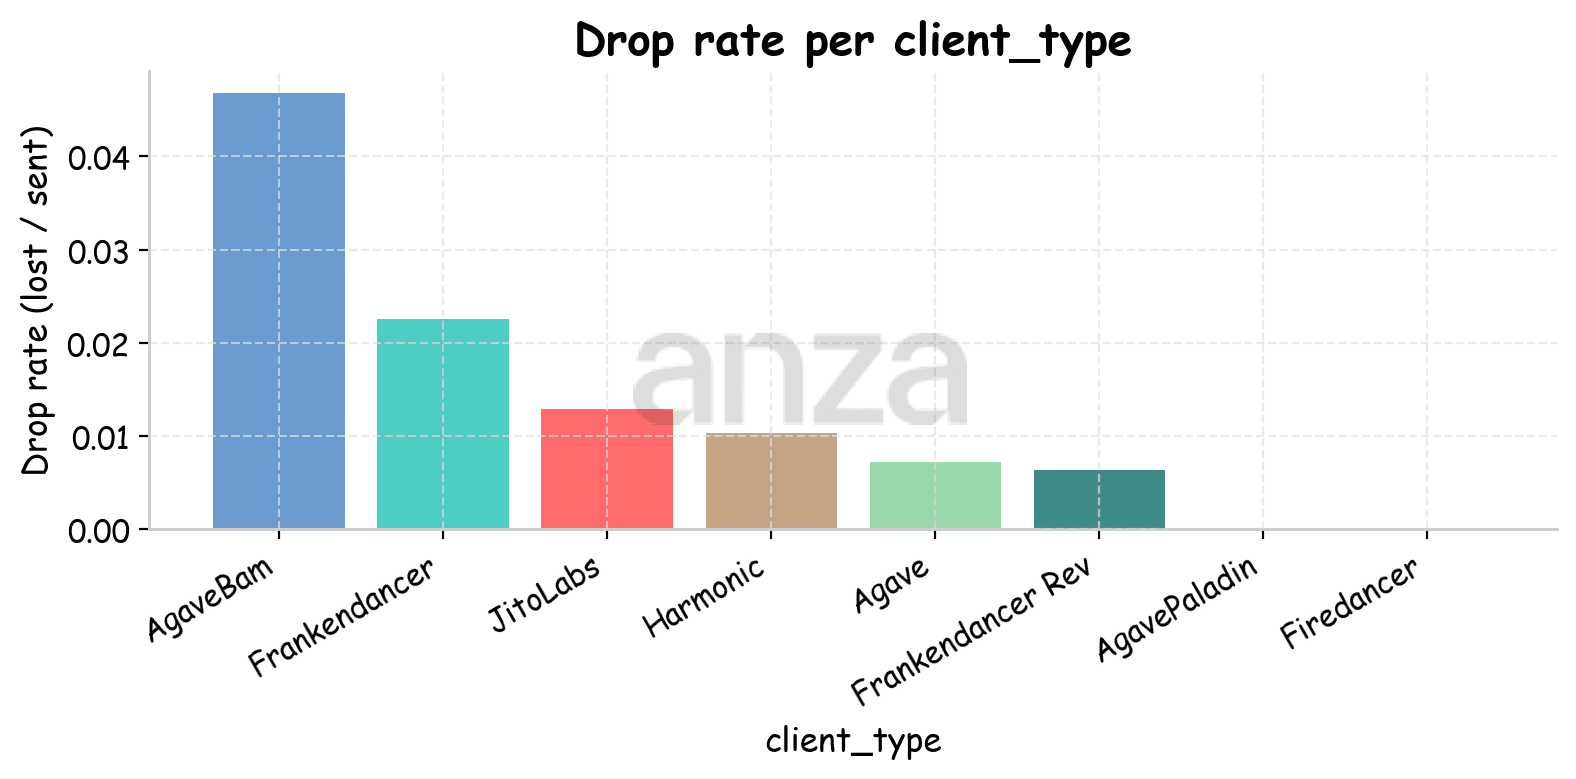 |
Fig 11. Drop rate per client type when the tool is located in Amsterdam (left) and in Tokyo (right). | |
Frankendancer ranks second by transaction losses, but there is no single failure mode. In our data, some FD validators skipped their leader slots entirely (for example, the slot range 397970968-72). Others appeared misconfigured and produced blocks containing only vote transactions, accepting no non-vote transactions at all (397971856). A third category behaves normally at the beginning of its leader window but starts dropping transactions in subsequent slots.
To illustrate this third pattern, consider the leader window starting at slot 397973076. It demonstrates distinctive pattern:
During the first slot of the leader the transactions are landing normally,
After second slot all of the transactions are lost,
Often sent slot is advancing with lack which indicates shred delays
For example, we successfully sent transactions 15674 and 15675 to the validator at 138.226.230.195, but subsequent transactions did not land until leadership changed. Estimated slot 397973078 is not advancing for several slots meaning that the leader was delaying first shred indicating the start of the slot. In this window, the final slots were only ~6% full, whereas the next leader’s slot was 100% full, which means that this validator was dropping not only our transactions.
We observed that this behavior was more common before a recent FD update. Notably, the validator above was running an older version (v0.808.30014). One change in newer releases likely contributed to the improvement: FD blocklists core 0 to be used for tiles to prevent interference with OS kernel threads that often run on these cores.
Tx ID | Sent slot | Receive slot | Transaction status |
15674 | 397973076 | 397973078.0 | Sent(138.226.230.195:9007) |
15675 | 397973078 | 397973079.0 | Sent(138.226.230.195:9007) |
15676 | 397973078 | Sent(138.226.230.195:9007) | |
15677 | 397973078 | Sent(138.226.230.195:9007) | |
15678 | 397973078 | Sent(138.226.230.195:9007) | |
15679 | 397973078 | Sent(138.226.230.195:9007) | |
15680 | 397973078 | Sent(138.226.230.195:9007) | |
15681 | 397973078 | Sent(138.226.230.195:9007) | |
15682 | 397973078 | Sent(138.226.230.195:9007) | |
15683 | 397973078 | Sent(138.226.230.195:9007) | |
15684 | 397973078 | Sent(138.226.230.195:9007) | |
15685 | 397973079 | 397973080.0 | Sent(138.226.230.195:9007)|Sent(185.191.116.203:9007) |
Appendix: Triton’s GRPC For Slot Updates vs Custom Geyser Plugin
We began this investigation by using an in-house Geyser plugin to stream slot update data to the rate-latency-tool. In this setup, the plugin is intentionally minimal and delivers data over UDP to the tool running on the same host as the validator. However, to run our tool on hosts without a validator, we need to rely on an alternative source of slot updates. This motivated an evaluation of the quality of slot update data—specifically in terms of observed slot latency—produced by our Geyser plugin compared to an industry-standard solution, namely Triton One’s yellowstone-grpc. We find that, when comparing slot latency on the Utah host (where a validator is running), the mean latency is very similar for both approaches, with the in-house plugin showing 0.43 ± 0.59 slots and Triton One showing 0.41 ± 1.08 slots, although Triton One exhibits a slightly longer tail. Based on these results, we chose to use Triton One’s data stream for the remainder of this blog post.
Data
All the data collected and analyzed for this blog post can be found at https://github.com/KirillLykov/blog-data.
Acknowledgements
We would like to thank TritonOne for giving us access to yellowstone-grpc, to Jito for giving access to their database containing historical information about which software validators are using. Special thanks to Louis-Vincent Boudreault from TritonOne (github) for helping with entry fetching and analysis. We are also grateful to Hervé Guillemet (Puffin validator) for fruitful discussions regarding Frankendancer nodes operation.